Auto Price Precision: Analyzing Car Features for Prediction
Business
This analysis has served to develop several models that will predict the price of a car using variables or features.
Besides using analyze individual feature patterns with visualization techniques, descriptive statistical analyses were also performed to summarize the data and gain insights into its distribution and relationships. Finally, various regression models were built and evaluated using a machine-learning library and these models were used for prediction and decision making.
GOAL
This analysis aims to explore the features of a car and develop predictive models to predict its price.
-
What are the main characteristics that have the most impact on the car price?
-
How is the car price dependent on the x variable?
-
What is the best model to be able to predict the car price?
RESULT
Curb-weight, Engine-size, Horsepower and Highway-MPG are the main numerical variables to take into account when predicting the car price.
The Multiple Linear Regression model is the best model to predict the price from the dataset. This result fits since there are 27 variables in total and it is known that more than one of those variables are potential predictors of the final car price.
Exploratory Data Analysis
What are the main characteristics that have the most impact on the car price?
Continuous Numerical Variables
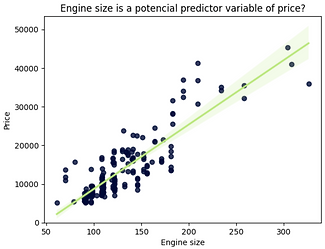
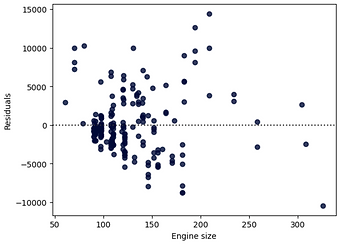
As engine size increases, price increases: this indicates a direct positive correlation between these two variables.
Engine size seems to be a good indicator of price, as the regression line is almost a perfect diagonal line.
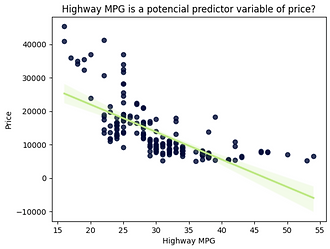
As highway MPG increases, price decreases: this indicates an inverse or negative correlation between these two variables.
Highway MPG could potentially be an indicator of price.
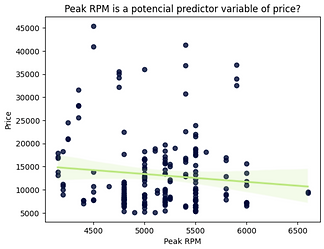
Peak RPM does not seem to be a good predictor of the price, as the regression line is almost horizontal. In addition, the data points are very dispersed and far from the fitted line, showing a lot of variability.
Therefore, it is not a reliable predictor variable.
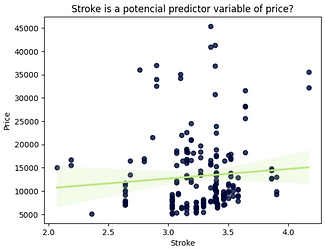
Stroke does not seem like a good predictor of the price at all since the regression line is close to horizontal. Also, the data points are very scattered and far from the fitted line, showing lots of variability.
Therefore, it's not a reliable variable.
Categorical Variables
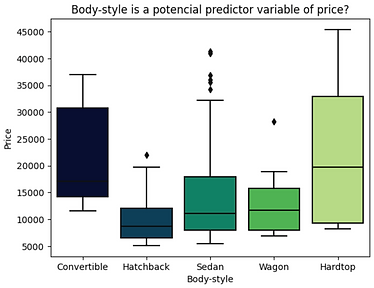
The price distribution between the different body style categories has significant overlap, which means that body-style would not be a valid predictor of price.
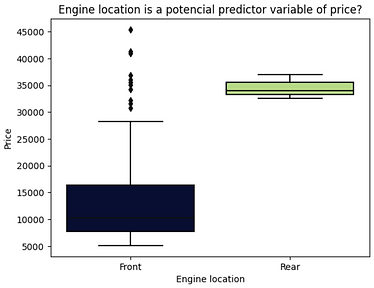
The price distribution between the two engine-location categories, front and rear, is sufficiently distinct to consider engine-location as a potential predictor of price.
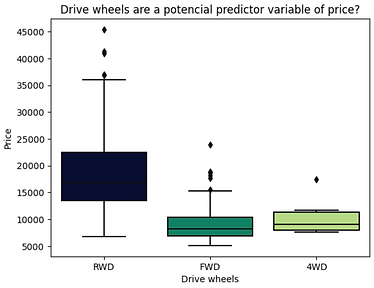
The price distribution between the different categories of drive wheels is quite different. As such, drive wheels can potentially be a price indicator.
Engine Location
Front 198
Rear 3
After examining the value counts of engine location, it is found that engine location would not be a good predictor variable for price. This is because there are only three cars with a rear engine and 198 with a front engine, therefore this result is skewed. Consequently, no conclusions can be drawn about the engine location.
Drive Wheels
FWD 118
RWD 75
4WD 8
However, this is not the case with drive wheels. Thus, drive wheels are effectively a good predictor of a car's price.
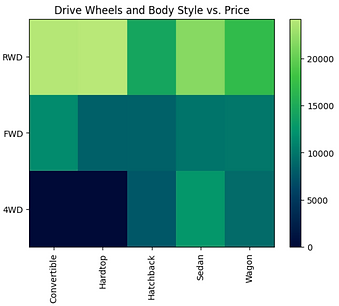
The heat map represents the target variable (price) proportional to colour in relation to the variables "drive wheel" and "body style" on the vertical and horizontal axis, accordingly. This enables visualization of how price is related to "drive wheel" and "body style".
How is the car price dependent on _____ variable?
CONCLUSION
Continuous numerical variables to take into account when predicting the car price: Curb-weight, Engine-size, Horsepower and Highway-MPG.
Categorical variables to take into account when predicting the car price: Drive-wheels.
Now is time to move into building machine learning models to automate the analysis and improve the model's prediction performance.
The analysis code can be visualized in:
Model Development
What is the best model to be able to predict the car price?
Linear Regression

Highway MPG
Equation
Price = 38423.31 - 821.73 x Highway MPG
R-square
0.497
MSE
3.16e+07
Engine size
Equation
Price = -7963.34 +166.86.73 x Engine Size
R-square
0.761
MSE
1.50e+07
Polynomial Regression

Highway MPG
Equation
Price = -1.557 Highway MPG + 204.8 Highway MPG - 8965 Highway MPG + 1.379e+05
R-square
0.674
MSE
2.05e+07
3
2
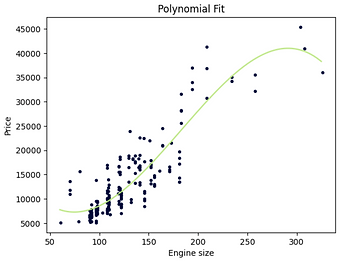
Engine size
Equation
Price = -0.006641 Engine Size + 3.645 Engine Size - 433.4 Engine Size + 2.208e+04
R-square
0.790
MSE
1.32e+07
3
2
Multiple Linear Regression
Horsepower, Curb-Weight, Engine Size, Highway MPG
Equation
Price = -15806.62 + 53.50 Horsepower + 4.71 Curb- weight + 81.53 Engine Size + 36.06 Highway MPG
R-square
0.809
MSE
1.20e+07
CONCLUSION
Linear regression: The R-squared in combination with the MSE shows that the regression with the variable "Engine Size" seems to be the most suitable model in this case, compared to the regression with "Highway MPG". The R-squared and MSE are very small compared to those obtained with Highway MPG as predictor variable.
Polynomial Regression: Since the Polynomial Fit using Engine Size as a predictor variable of price resulted in a lower MSE and a higher R-squared, one can conclude that this was a better-fit model than the polynomial regression for predicting "price" with "Highway-MPG" as a predictor variable.
Linear Regression vs. Polynomial Regression: Since the polynomial fit resulted in a lower MSE and a higher R-squared, for predicting "price" with "Engine-size" as the predictor variable, it can be concluded that this was a better-fit model than the simple linear regression.
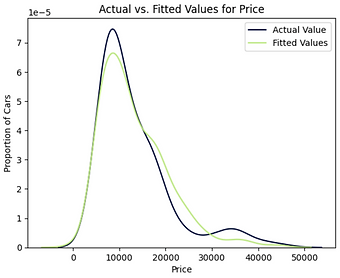
Polynomial vs. Multiple Linear Regression: The MSE for the multiple linear regression is smaller than the MSE for the Polynomial Fit using Engine Size as a predictor variable. Furthermore, the R-squared is also much larger. So, the Multiple Linear Regression model is the best model to be able to predict price from the dataset.
The analysis code can be visualized in: